Ashish Nambisan : Last week It was suggested that “Avoid going shorts here instead use rise to sell, the hurdle remains at 22400 go short at or near 22350/22400 with a stop strictly above 22550. Now what if we does not see any rise, I would say then its better to watch the market’s behaviour near 21900/21800 cause markets have a tendency to correct a bit more in intraday and then reverse so only a very aggressive trader (means the one who can dare to lose the money on a contra bet) or who doesn’t want to short the market and is a dare devil can attempt a buy near 22000 with a strict stop of 21800. Remember this contra bet would be like catching a falling knife as in my earlier article I had stated that we cannot ignore the fall till 21280. Any breach or crossover below 21800 we may test 21280 and markets may become very vulnerable to break all the levels so be very cautious. Don’t try to catch bottoms, sit on cash and wait for a reversal before jumping.” What happened next? On the view for Nifty, it was clearly and boldly stated to avoid going shorts and those who are dare devil can think of buying Nifty with a stop of 21800. Nifty 50 as stated made a low of 21964 and from there we saw a reversal till 22633 taking the short-sellers stop of 22550.
Last week we had a shift in stance as Nifty was trading at its long-term average valuation, while earnings growth estimates remain conservative compared to market consensus, however the market reaction had been in line with our bearish view since the start of October 2024 where we stated that indices have formed a Head & Shoulder pattern and is ready for a big correction and henceforth, we witnessed that correction. The bullish trading view on Nifty given last week doesn’t say that we are overall bullish, all it meant was Nifty 50 seemed constructive from the mark of 22000. The continued sell-off till last week had wiped out a staggering ₹94 lakh crore of investor wealth. In the past 5 months both Sensex and Nifty plummeted up to 16% from the life highs in September 2024. In this year we almost lost up to 7% erasing ₹62 lakh crore of the investor wealth. Since Covid-19, I suppose February would be the worst month for the Indian stock market eroding investors wealth by ₹40 lakh crore reflecting persistent bearish sentiment. Millions of middle-class investors, many of whom entered the market during the post pandemic boom are now facing significant losses. With rising inflation, stagnating wages and increasing financial pressures, their confidence is being severely tested. The shift in growing interest in China and geopolitical uncertainties have only added fuel to market volatility. Six years ago, before Covid-19 only one in 14 households invested in stocks, today the number has surged to one in 5. Now, this shift has been driven by govt policies prompting financial inclusion, easy access to online trading platforms and the influence of social media encouraging the market participation. SIPs had become a popular route for investors with the number soaring past 100 million nearly three times the figure five years ago. But now many are seeing their portfolios shrink, a very harsh time for those who moved their money from savings to equities. Thus, the market correction has exposed the risks of over reliance on stocks particularly among inexperienced investors. Many are now considering shifting funds back to safer assets but then they will have to face the losses so it becomes a challenging decision. The current downturn serves as a blunt reminder that stock market investments require careful risk assessment and long-term planning rather than speculative bets. Now the question is what should we expect? Let’s try to look into the slump first. Last week I already mentioned that we are now sitting at a good valuation another point is FIIs selling has eased since February which also indicates that the worst maybe over, valuations for many stocks have now fallen below their 10-year average which could attract institutional buyers. Govt tax relief will also support consumer spending and corporate earnings in the coming months. Stable interest rates could provide some stability to the markets however global risks and US trade policies remain a concern. Let’s consider some factors responsible for the crash and then look at the technical image.
Impact on Currency
The reciprocal taxes drove US bond yields and boosted demand for dollar dominated assets. This triggered capital outflows and dampen foreign investors’ demand for Indian financial assets like equity and rupee. On Feb 10 we saw that rupee slipped to the lowest till 87.997 against the dollar, registering fifth straight monthly fall mainly due to growing strength of the dollar in global market and a negative trend in domestic equities.
FII Outflows
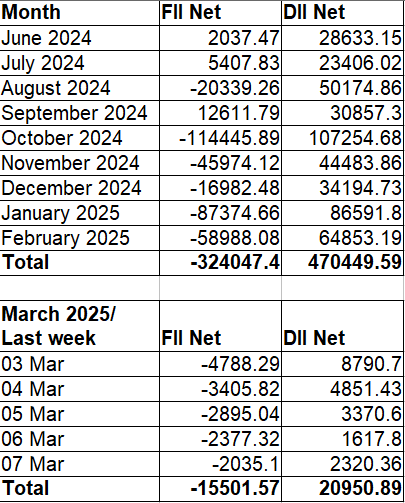
The domestic markets have been impacted due to Trump’s tariff threats, economic growth slowdown and weak earnings, sustained selling by foreign investors has triggered a ripple effect in Indian equities. The foreign investor sell-off started in October last year due to valuation concerns and subdued economic growth, it intensified in 2025 after the US govt announced tariffs against Canada, Mexico and China raising fears about a global trade war.
China effect
The improving market prospects of Chinese equities amongst the govt initiatives to revive the Chinese economy are also hurting Indian equities as the new initiatives of the govt attract positive response from the FIIs which means more bad news for Indian markets as more money will flow into China through Hang Seng exchange, now the point to be NOTED is that the price to earnings (PE) of the Hang Seng index is only 12 compared to the 18.5 one year forward PE in India. Now the Silver lining is that large caps are fairly valued in India which can attract standardized buying in this segment.
Demand for safer Assets
Riskier Assets such as equity has declined significantly while growth in safer assets has increased which are considered low-risk and stable in value like govt bonds, high quality corporate bonds, fixed deposits and Gold. Recently we have seen gold prices hitting new highs driven by strong demand amid fears of inflation linked to the US tariffs. The uncertainties surrounding global economic growth, geopolitical instability and central bank reserve diversification have also boosted investors’ appetite for bullion.
Overview on Technical Charts
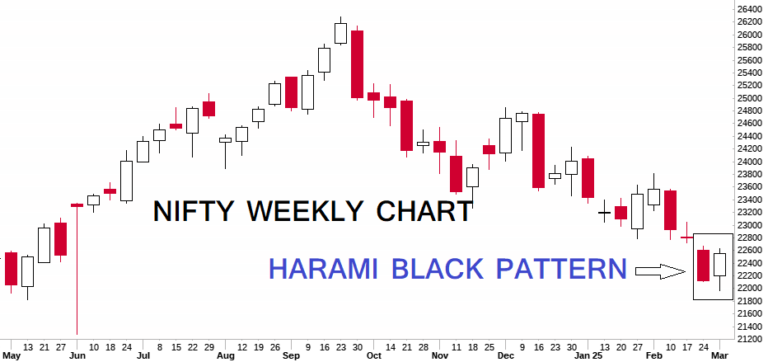
FIIs relentlessly continued their selling for the week with net selling worth ₹15502 crores in cash segment while DIIs remained net buyer worth ₹20951 crores in cash. The weekly bar chart of the Nifty rose for the first time after three straight weekly falls and the candle was close enough to engulf last week’s fall but couldn’t, converting it into a “Harami Black” pattern (bullish candle that falls within the body of the first candle). Moreover, it also took the resistance of 22550 on closing basis which should not be ignored. Although we are above 22550 and we also have an ‘Harami Black’ pattern identified but we are still not comfortably placed as ‘Harami Black’ patterns reliability and success ratio is of 60-70% in predicting a reversal in market trend. Thus, we may conclude that we watch and consider other tools with this pattern to remain on the safer side. So, above the high of Harami candle i.e. 22634 we may see higher rises.
NOTE: A ‘Harami Black’ formation is just one of many candlestick patterns and its reliability can vary depending on the market context and technical analysis factors.
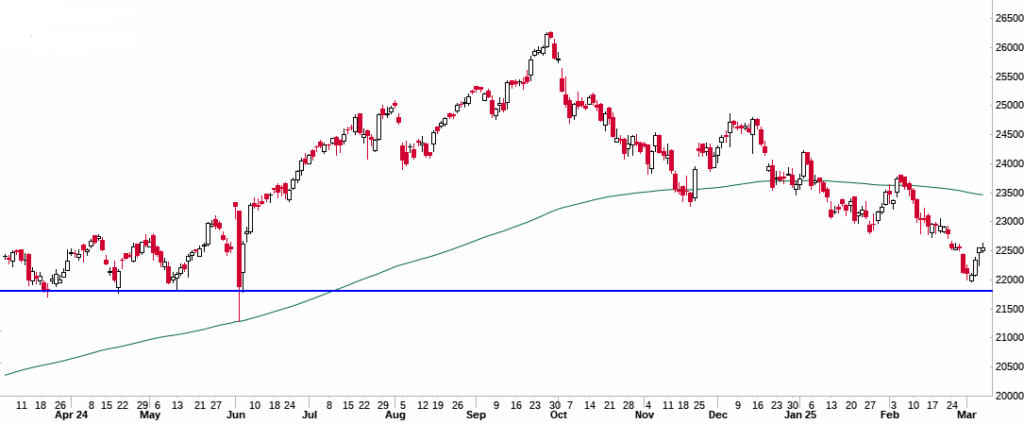
Conclusion: A good reversal is seen from 22000 managing a close above 22550 with a ‘Harami’ formation indicating an upside however we should not ignore that we are still in a falling trend and we haven’t managed above the crucial 22670 mark which is also a golden ratio of 61.8% Fibonacci. The supports are placed at 22400/22200. It is best to buy near supports with stops at or below 21960. Needless, to say that markets have not taken our support level of 21800 last week, which becomes more stronger as market respected it last week. So, till 21800 remains protected we are safe. Only a fall below can rupture the market towards 21500/21280. On Monday if we manage to stay above the mark of 22700 the implications will turn more bullish and we may try to touch even 23000 soon. Henceforth the mantra should be buy near the supports of 22400/22200 or buy above the 22700 mark for a target of 22900/23100.