
Ashish Nambisan : Last week it was suggested “The index has now formed a death cross pattern, hinting a more downward momentum. The index crashed to a crucial support level at 22700 and is hovering near its lowest level this year. The daily charts shows that Nifty 50 has peaked at 26277 in 2024. The RSI and the MACD have continued their fall after giving a positive divergence which is another bad sign. The crucial level of 22700 has been often tested now which makes it vulnerable to be broken sooner than later. On the other hand, Nifty 50 has formed a falling wedge pattern which is a bullish sign. Therefore, the index will likely remain under pressure for now.
Conclusion: Although as of now continually we are witnessing that the mark of 22700 have acted as a strong protection shield for the bulls since weeks now. But remember any support or resistance if revisited often becomes vulnerable and is more likely to be easily violated. The only bullish sign is that we are trading in a falling wedge but that is not enough. All the up moves till 23060/23150 will be a chance to go short with a stop above 23450. However, Nifty 50 till the time remains below 23550 bears will have an upper hand. The current technical scenario has shifted to the bearish side, if we happen to breach the mark of 22700 and break the falling wedge on closing basis than a much deeper correction till 21280 cannot be ignored. On the break down we can initially drop till 22450/22250/22000. Remember unless we do not close above 23060 it would be difficult for the bulls to protect the mark of 22700. So be cautious on bullish play, it is better to avoid bullish view as of now, as all upside will be used by the bears unless we do not manage a close above 23550. So don’t dive to buy anything and everything use your prudence. Bears have taken the grip now and we are ready to break anytime soon so be prepared for a downside till 22000. Watch 23060 only as a chance where bears may use it as a shorting opportunity”. What happened next? Nifty 50 on Feb 24 opened gap down 22609 which was below 22700 it tried to cross over 22700 but failed placing a high just below it at 22668 and finally it remained below 22700 for the entire day. After this entire development of technical’s on chart the indication was clear and ultimately on Friday 28th Feb we hit placing a low of 22104 almost near our target of 22000 hardly 100 points remaining.
Nifty 50 corrected from the highs of 26250 and now its almost close to 22100 which means nearly a 16% correction from the top. So, can we presume that Index corrected based on high valuations, slow growth, and of course Trump’s accelerated tariffs well I guess it can be. Anyways, not an expert to talk on that. Well, let me talk on one parameter which is called as a market mood indicator known as PE. I will brief the readers on the (Price to Earnings) which is known as PE. Firstly, understand how to calculate the PE, today Nifty 50 is at 22125 and the total earnings of its constitute stocks are 1125, so the Index PE = Current Price/EPS (Earning Per Share) that means 22125/1125=19.7. Nifty If we try to look into the past, the highest PE (Price to Earnings) numbers of Nifty was just after Covid in Feb 2021, when we reached a peak of 41.23 PE, which remains the highest ever till date. In 2008 correction Nifty’s PE fell from 28.29 PE till 10.68 PE whereas at the time of Covid correction in 2020 we fell from 29.9 PE to 17.15 PE and this time we have fallen from Feb 08, 2021 peak of 41.23 PE to 18.92 in June 2022 and now in 2024 Sept we were at 24.34 and now we are at 19.7 PE. Looking at the above data can we believe this correction to be a decent one, well the reply to that one is not so easy but yes investors can look into fundamentally sound companies, keeping in mind this is not the only parameter to judge the Index there are much more but it’s widely used so better do your homework thoroughly before you jump to any conclusions. Let, me inform you that during the pandemic threat the Index (numerator) fell while earnings (denominator) remained static. This means that PE just crashed and later from April onwards the index has been rising while earnings have been falling. Now this has also led to the sudden expansion of PE ratio due to double impact of rising numerator and falling denominator. The question here is why this parameter can be even considered now the answer to that is simple because the long-term average PE ratio for Nifty based on the historical data is around 18-20 but it can vary depending on the time frame and market conditions., that means if the historical PE ratio for Nifty is 18-20 the current PE ratio of 19.7 might indicate that market is at a value for investing limited with only 15% of your total investing amount but I would still say do your homework before investing and asak your financial advisor on that as this is not the only parameter to judge the Index. Now let’s find out the technical picture and reasons for the markets move ahead.
In the start of 2025 Rbi had started to cut rates by 0.25% from 6.5% to 6.25% in January, first time cut in over 5 years so can this continue? Well economists and bond market believe so it’s not my say. Now historically the index has rose in March for 7 times in the last 10 years, well this also doesn’t validate that it will rise but it’s just a highlight. However, the compounds like Govt spending in the country and the fact that it has implemented some tax cuts to stimulate spending cannot be ignored. Apart from this Vix has been falling since last 7 sessions which also is a sign that investors are not dumping the stocks and might be moving to the hedges.
FIIs continued their strong selling during the week with net selling of 22011 crores in cash while DIIs tried their best to match them with a buying of 22252 crores in cash segment for the week. Indian equities on Friday were lower as losses in Technology, Auto, Public sector and Reality sectors led the indices lower. At the close Nifty 50 fell 1.88% to hit a new 6 month low. The biggest gainers were Hdfc Bank ltd which rose1.73 % and others were Shriram fin with 2% and Coal with 1.5% while some of the biggest losers were IndusInd with 7%, Techm with 6.44%, Wipro with 5.43%, Bharti with 4.93% and M&M with 4.82%. There were 45 declines with 5 advances. The Vix which measures the implied volatility of Nifty 50 options, was up by 4.53% to 13.91. The USD/INR was up 0.16% to 87.46, while EUR/INR rose to 90.93 with 0.12%. the US Dollar Index futures was up 0.12% at 107.30.
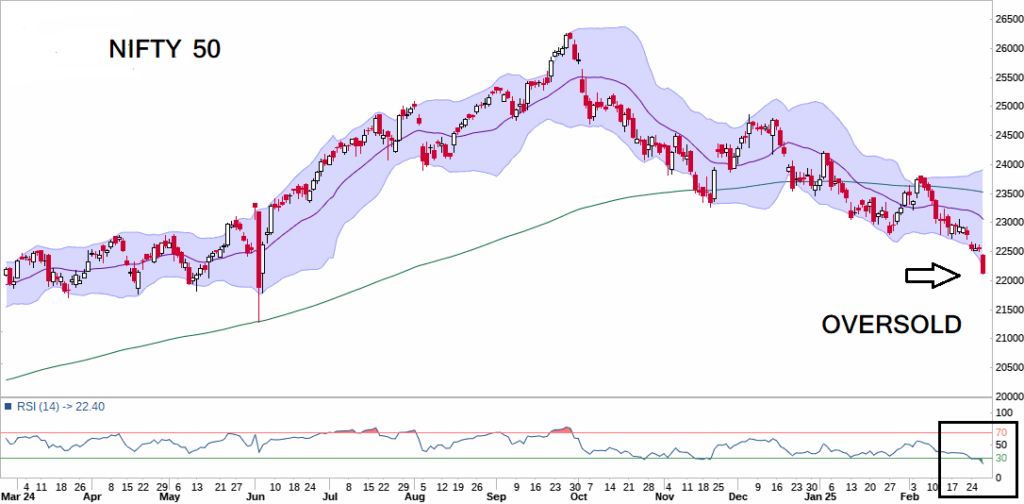
Nifty 50 is trading in oversold territory with all the indicators melting the RSI has slipped below 20 on the daily charts indicating more selling. The index has already penetrated the lower Bollinger band also the stochastics is well inside its oversold zone so the question remains, can we see a likely bounce or will it get terminated and we may edge lower towards 21800 and 21280 well only the market has the answer to that question. It would be inappropriate to judge that we may bottom out here before any reversal, as markets have been severely crashed and this would be too early to state or find a bottom.
Conclusion: Last week the given targets were 22250/22000 now we are almost close to the level of 22000 so technically I would say this is not the level to go short for traders. Avoid going shorts here instead use rise to sell, the hurdle remains at 22400 go short at or near 22350/22400 with a stop strictly above 22550. Now what if we does not see any rise, I would say then its better to watch the market’s behaviour near 21900/21800 cause markets have a tendency to correct a bit more in intraday and then reverse so only a very aggressive trader (means the one who can dare to lose the money on a contra bet) or who doesn’t want to short the market and is a dare devil can attempt a buy near 22000 with a strict stop of 21800. Remember this contra bet would be like catching a falling knife as in my earlier article I had stated that we cannot ignore the fall till 21280. Any breach or crossover below 21800 we may test 21280 and markets may become very vulnerable to break all the levels so be very cautious. Don’t try to catch bottoms, sit on cash and wait for a reversal before jumping.
Note: Markets can remain in oversold territory for weeks. A strong downtrend can remain oversold for an extended period.