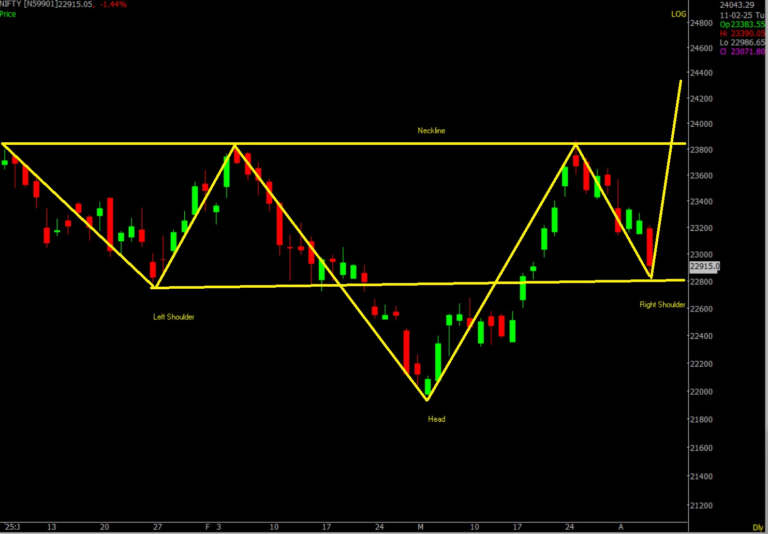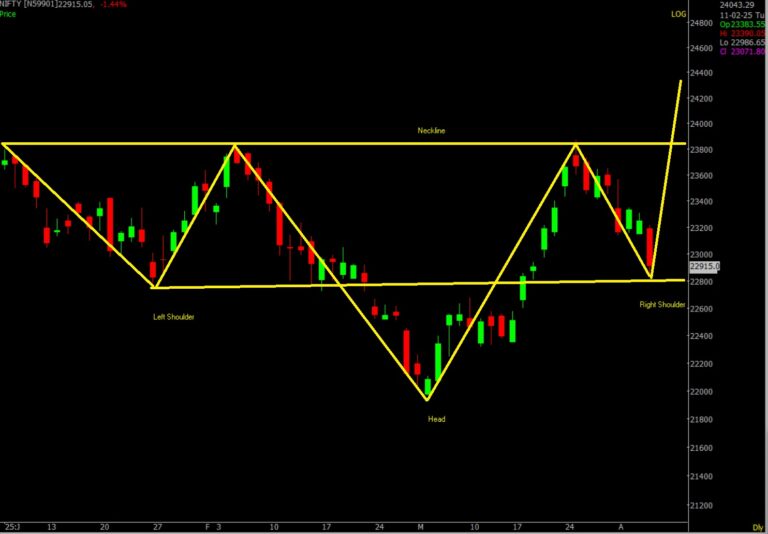
Ashish Nambisan : Last week it was suggested “Nifty50 dropped inside the wedge again making it difficult for the bulls to reclimb, thus creating bearish implications once again adding fear of tumbling back to 22000. On the contrary the technical charts amidst this descending trend have again come up with a pattern which holds bullish implications when formed, please find the chart below to understand the pattern formation where one can easily spot the ‘left shoulder’ and the ‘right shoulder’ and also the ‘neckline’ which is placed at 23800/23900. However, like any technical pattern, it is not fool-proof, and failures can occur depending on the circumstances. We have just witnessed the falling wedge break out going awry. Usually the Inverted Head & Shoulder pattern is formed after a down trend. The readers here may get confused, thinking how to deal with these 2 unusual changes. Well, as I said earlier, the situation has become tricky, as 2 unusual phenomena are at play: one strange condition journeys North, while its counterpart travels in the opposite direction, towards the South. So, what to do in this tricky situation? I think the best play would be to watch out levels for fresh trades. The markets have already corrected till 22000 and made a short-term bottom. So, instead of jumping into assumptions, lets first see the market reaction and then come to conclusion. Nifty50’s crucial support to watch is 22700/22400. If by any chance we open below 22400 or break and close below it then avoid all longs and wait patiently to understand whether we are surrendering our previous short-term bottom of 21964. As a break or close below 21964 will indicate that the entire bullish implications would get invalidated. However, if we are able to hold 22700/22400 positively then try to take a chance on contra bets and go long, as even after a fake upside breakout of the wedge, Nifty50 again managed to add one more feather on the cap and i.e. “Inverted Head & Shoulder” pattern. What happened next? Dropping inside the wedge proved fatal it led to the failures of all the bullish theories. And the market opened with a huge gap down plummeting below the previous low of 21964 and forming new lows at 21743. 65.
US Market
The US markets experienced sharp gains on Friday as big banks kicked off first-quarter earnings season and witnessed a turbulent wild swing due to escalating trade tensions under the Trump administration which overshadowed otherwise positive economic data, highlighting the growing impact of trade policy on investor sentiment. All the major indices ended the session higher after the FED Reserve President Susan Collins head of the Boston FED assured that the FED is prepared to keep financial markets functioning if the need arise. China retaliated to the Trump’s recent hike of tariffs to 145%. The trade war escalation has caused wild swings and drove consumer’s near-term inflation expectations to their highest level since 1981. Though Trump has suspended targeted tariffs for 90 days, he maintained a 10% blanket duty on almost all US imports as well as a 25% tariff on motor vehicles, steel and aluminum. This reflects the growing anxieties surrounding the potential for a recession as tariff standoff intensifies, raising concerns about the long-term economic outlook. Consumer’s 12-month inflation expectations soared to 6.7% this month the highest reading since 1981.
Indian Market
After a setback till 21743.65 on Nifty50, markets experienced an ecstatic session on Friday, marked by a broad-based rally led by escalating metal stocks. The surge was powered by US’s decision to suspend additional tariffs on India until July 9, providing a comfortable boost to investor sentiment and lifting the market confidence. The Sensex was up by 1310.11 points or 1.77% higher and closed 75157.26, while Nifty50 climbed 429.4 points and closed with gains of 1.92% at 22828.5. The Nifty-Midcap and Smallcap indices also participated in the rally, gaining 2-3% indicating a healthy sign across the market capitalization spectrum. In complete, the breadth of the rally was impressive with 2381 advances and 492 declines on NSE. In nutshell the unexpected pause on reciprocal tariffs provided the relief.
Technical Charts
FIIs have been net sellers for the week in cash segment worth 20911 crores while DIIs have been net buyers in cash worth 21956 crores. Nifty index faces resistance at 23000, only a decisive close above can take it to 23400. While on the downside Nifty50 has an immediate support at 22600/22400/22250. It appears bearish unless the index manages to close above 23000, however on daily charts a positive divergence is spotted hence a rally was triggered till 22923.9. Now the question here is, will this point of 23000 be taken or will it fail? To understand this more we should look at the previous low which was at 21964 and this week’s low was at 21743.65 that is both the lows has a difference of 221 points which means it cannot be called a double bottom. Let me explain this to the readers i.e. if we have a large price range then the 221-point difference is relatively small so it becomes a debatable issue but if thought in lateral way then it is. Another progress is a “Broadening formation” pattern is also spotted, indicating increasing volatility and uncertainty in market. This pattern characterizes with higher highs and lower lows and the implications are that it may lead to a significant breakout on the upside or downside. Remember this pattern indicates uncertainty, so traders should exercise caution when trading this pattern as increased volatility can culminate with significant losses, so closely monitor the volatility and adjust your trading strategies.
Nifty50 has reclimbed the falling wedge and managed a close above it once again, which highlights the necessity to re-evaluate the situation. What, I mean here is last week it closed inside the wedge and signaled a sell indication, while this time it jumped above the wedge resulting in bullish view once more.
Conclusion
Nifty50 has reclimbed the ceiling of the falling wedge which indicates a slower falling rate with a bullish view again. An Inv H&S was under development but failed to form. A ‘Broadening’ formation has been spotted with a positive divergence on the charts. The above formations have helped the Nifty index to reach near its resistance at 22923.9. So, further rally should be expected only above a close of 23000. The downside supports are seen at 22600/22400/22250. If Nifty50 manages to close above 23000 then it may try to touch 23400 mark. Situation may go in hands of bears, if it fails to protect 22600 on downside, as a close below will mean we are again inside the wedge. Bullish views should be welcomed above the falling wedge but this time watch the mark of 23000 closely and be bullish only above it, as whipsaws have become common in such an event and it can be a fake breakout, so for further confirmation Nifty50 has to give 2 consecutive close above 23300.

Trading Range
Upside can be expected above 23000. Bears can short the index near 23000 with a stop of 23400 while bulls should try to go long near the dips of 22400 with stop of 22000. Remember the breakout point of the upside ‘broadening’ pattern is 23900 and the downside is 21200. So, any close up or below will decide the further facets of the market. Till then buy on dips and sell on rise will be the strategy. Bulls will try hard to protect the mark of 22600 which is the breakout point of the falling wedge and bears may hit it hard to knock back below this level. Henceforth 22600 and 23000 are the most crucial points which decides the further play. For bears the risk will be closing above 23000, while for Bulls the risk will be closing below 22600.
Note: The upside point of the ‘broadening’ pattern is 23900 while the downside is 21200. Any breach of these points will decide the further move.